Close
- Get a Police Record Check
- Criminal Record Check
- Judicial Matters Check
- Vulnerable Sector Check
- Request Your Police Reports
- Freedom of Information Request
- Request a Paid Duty Officer
- Bicycle Registration
- Business with Toronto Police
- Parking Enforcement
- Report a Traffic Collision
- Towing
- Report illegal parking
- Resource Centre
- Form Centre
- Understanding Alarm Response
- Victim & Witness Resources
- Attempt/Threaten Suicide Information on CPIC
- Fingerprint & Photograph Destruction
- Vulnerable Persons Registry
- Book A Divisional Community Room
- Get Your Court Documents
- Conferences & Seminars
- Toronto Shield
- Services
- Get a Police Record Check
- Criminal Record Check
- Judicial Matters Check
- Vulnerable Sector Check
- Request Your Police Reports
- Freedom of Information Request
- Request a Paid Duty Officer
- Bicycle Registration
- Business with Toronto Police
- Parking Enforcement
- Report a Traffic Collision
- Towing
- Report illegal parking
- Resource Centre
- Form Centre
- Understanding Alarm Response
- Victim & Witness Resources
- Attempt/Threaten Suicide Information on CPIC
- Fingerprint & Photograph Destruction
- Vulnerable Persons Registry
- Book A Divisional Community Room
- Get Your Court Documents
- Conferences & Seminars
- Toronto Shield
-
Community
- Missing Persons Investigations
- Hate-Motivated Crime
- Human Trafficking
- Sexual Assault Survivors
- Know Your Rights
- Mental Health
- Crime Prevention
- Community Partnerships & Engagement Unit
- Road Safety
- Victim & Witness Resources
- Race and Identity-Based Data Collection
- Preventing Fraud
- Newcomer Safety
Follow Our Progress
- Toronto Police Service
- Race and Identity-Based Data Collection
- Follow Our Progress
- Race and Identity-Based Data Collection Interactive Dashboard Update
Race and Identity-Based Data Collection Interactive Dashboard Update
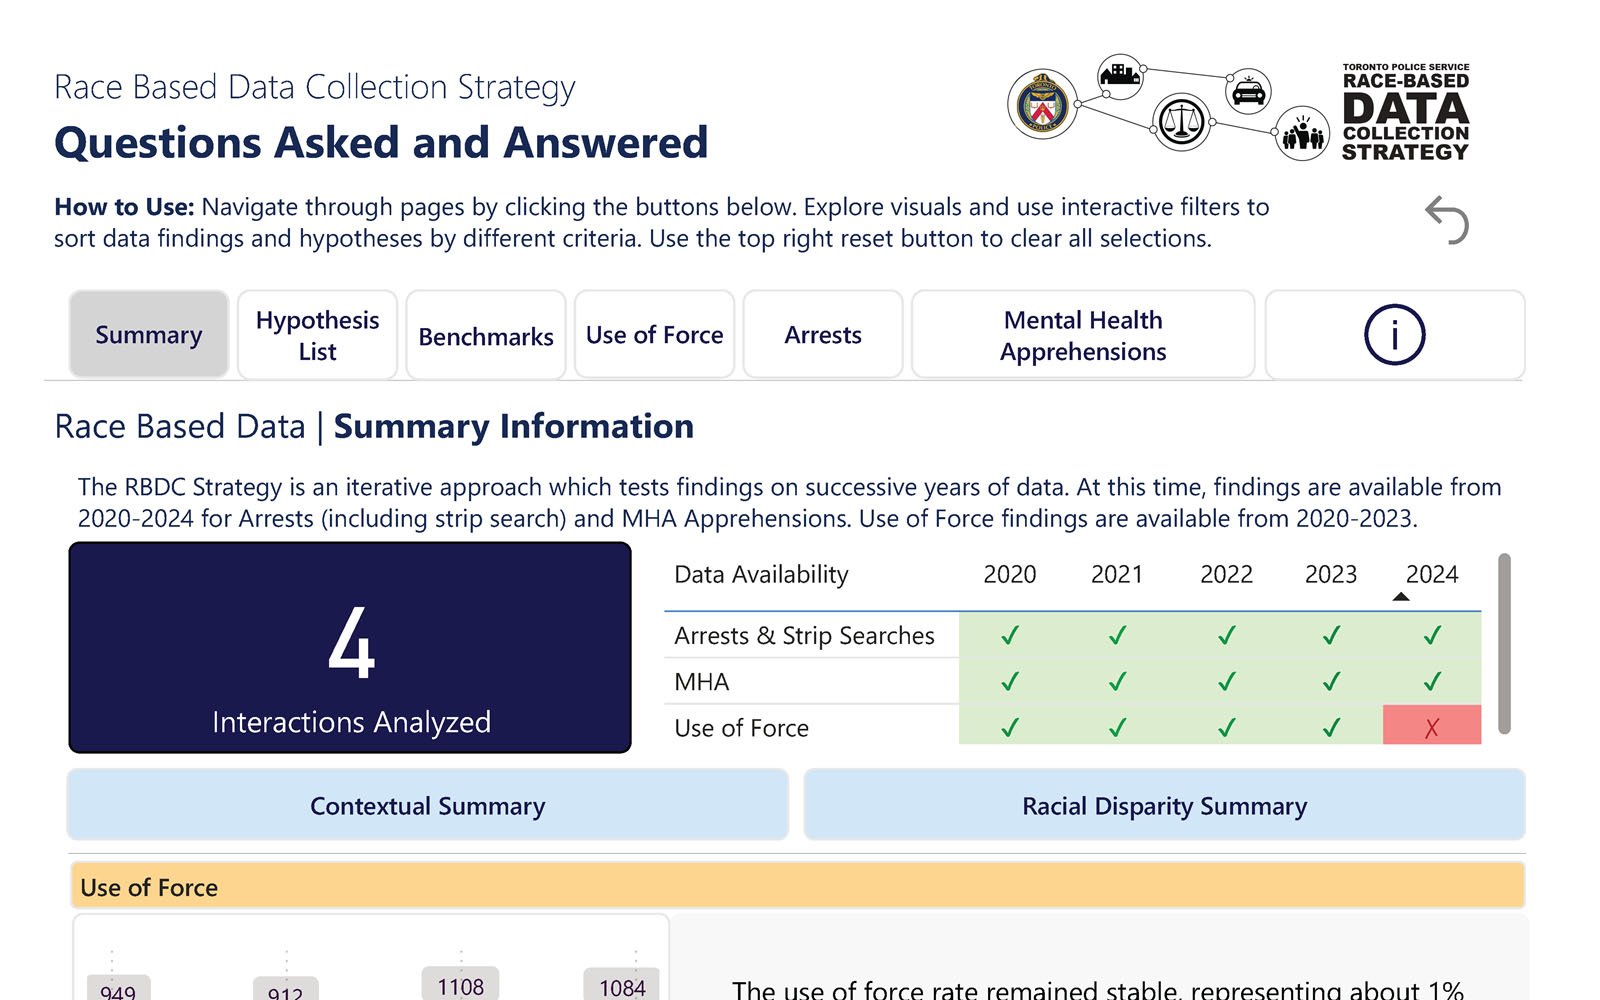
A complete trends analysis on police interactions obtained from all available data over the last five years is now available on a newly redeveloped Race and Identity-Based Data Collection (RBDC) interactive dashboard.
The RBDC interactive dashboard includes information on mental health apprehensions, arrests, and associated outcomes like strip searches for a five-year period and use of force incidents over a four-year period.
Key Findings and Stories
Several key findings and stories emerge from five years of collected data, shedding light on critical areas of police interaction:
- Use of Force: Despite the increase in general police activity, the use of force continues to be a low-frequency event, representing about 1% of enforcement actions each year. The data consistently reveals persistent over-representations for certain racialized communities. Notably, Black people were over-represented in use of force relative to their presence in enforcement actions, with racial disparities remaining relatively stable over time.
- Arrests: Between 2020 and 2024, arrests grew by 52% – most arrests followed a call-for-service into 9-1-1 or the police non-emergency line rather than a police-initiated event. Strip searches, one of the arrest outcomes, decreased by 97% during that same period. Racial disparities were at their highest for Indigenous women amongst all race groups.
- Persons in Crisis and Mental Health Apprehensions: In 2024, the volume of person in crisis (PIC) calls increased from 12,605 to 30,472. Most person in crisis interactions were because of a call-for-service into 9-1-1 or the police non-emergency line.
Arrests were very rare following a PIC call-for-service, representing about 2% of the total volume of PIC calls-for-service. Most mental health apprehensions (MHAs) were associated with person in crisis calls-for-service rather than a police-initiated event. White people were over-represented in MHAs while on par on the other interactions, with racial disparities remaining relatively stable over time.
Improved User Experience with New Redesign
Several significant enhancements to the RBDC interactive dashboard are designed to improve the user experience, including greater accessibility, increased context behind data findings and deeper insights. What’s new:
- The redesigned layout is easier to use and access information
- Users can generate deeper insights through enhanced select, slice, and filter capabilities
- Clearer summary pages, including frequency information and narrative summaries, provide context to better understand racial disparity information
- Complete trends analysis for five years of collected data is available and allows users to understand how racial disproportionalities in police interactions have evolved over time, while offering valuable historical context and highlighting areas of progress or concern.
- Providing information directly in the interactive dashboard on the RBDC methodology and process, including the unique multiple benchmark approach, aims to explain the findings and reach a broader audience.
Toronto Police Service’s Commitment to Transparency
The recent foundational update of the RBDC interactive dashboard enhances the accessibility and depth of Race and Identity-Based data that is presented to the public.
Consistent disparity metrics across all analyzed police interactions are displayed on the interactive dashboard, as well as a complete log of hypotheses that were collected through internal consultations and external community engagements.
The new iteration of the RBDC interactive dashboard reinforces the Toronto Police Service’s commitment to transparency and its continued excellence in the reporting of Race and Identity-Based data.